BlackBerry OS Distribution March/April 2011
~ 2 min read. Published 27 Apr 2011Just got an email from RIM with news and such and noticed the link to the OS center they run on their website to help developers choose which BB OS to target. After looking at the stats, I decided to make a comparison and see how the official stats from RIM differ from what I see within my applications.
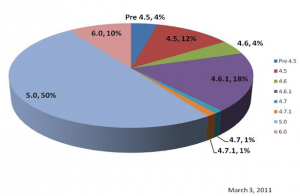
Here's the distribution published by RIM (dated March 3-d) I am not sure what they compiled into the March 3-d, i.e. what the timestamp of March 3-d actually means. Was it based on OS tracked for March 3-d, was it for last month, week or such. I couldn't find that information.
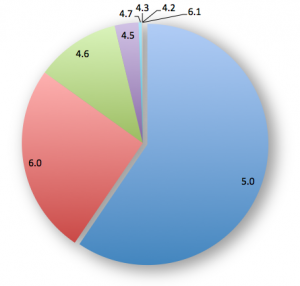
 And below is the distribution I have compiled from the data for the month of April 2011 (a month worth of data)
 The breakdown by OS version is not identical but the picture is pretty much similar, except that
 my chart is much nicer I've got 6.1 devices (hmmm!) and the 5.0 OS section is a bit larger for my statistics than it is for the official statistics. But again, the official statistics are pretty much 2 month old now and actually since the rest of the sections pretty much coincide with the official statistics, I would assume that the number of OS 5.0 just got larger in these 2 month; which by itself is great news for BB developers. Hooray to that and I will try to keep up with statistics to see how the distribution shifts, maybe another post in couple month or when something interesting happens. Let me know in the comments if you'd like to see something like that in the future and whether it was useful for you.
